Health is your
connected picture

HOW YOU FEEL
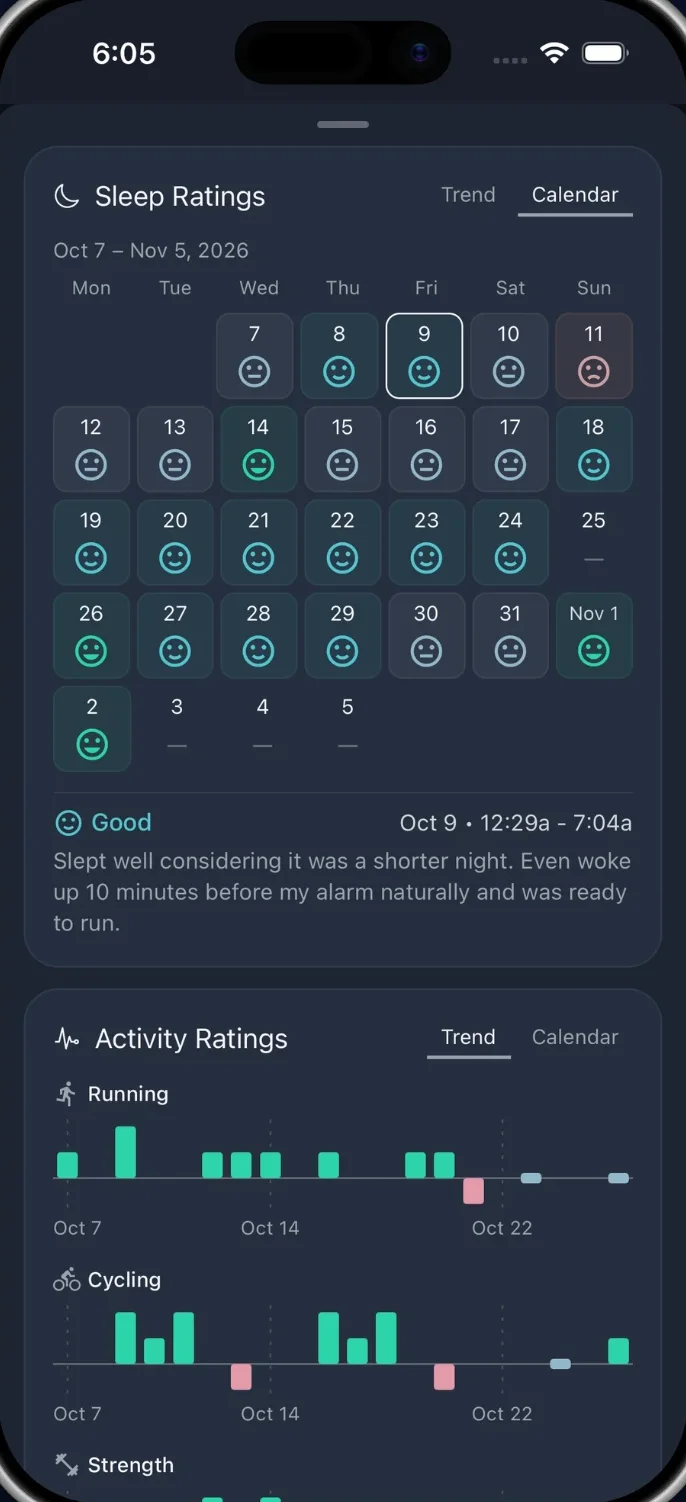
Capture how it felt, not just what happened.
Numbers can’t tell you how a night of sleep, a meal, or a workout actually felt. In Enphana, you add that part yourself, and it stays with the rest of your day.
- Check in. Record symptoms, energy, mood, and other experiences.
- Rate it and add a note. Choose a rating and write what you noticed in your own words.
- See it in context. Your check-ins appear next to your food, sleep, and activity, so you can look across days and weeks.
NUTRITION
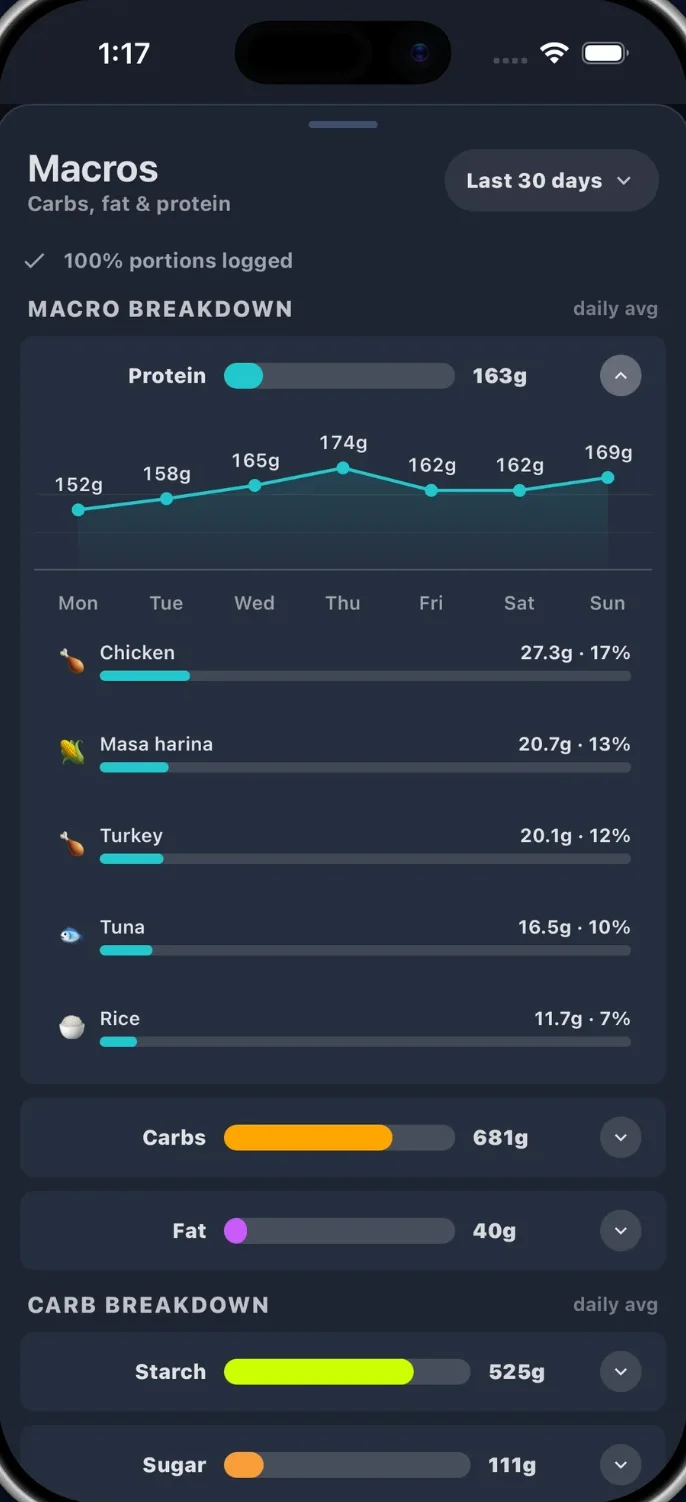
Log what you eat and see what’s in it.
Record meals as you go, and Enphana turns them into a clear view of the nutrients you’re getting and the foods they come from.
- Log meals your way. Scan barcodes, and save meals you eat often so they’re quick to add again.
- Look inside the numbers. Explore calories, macros, and micronutrients, and see which foods contributed most.
- Learn about what you eat. Read about the foods in your day as you build your picture.
SLEEP
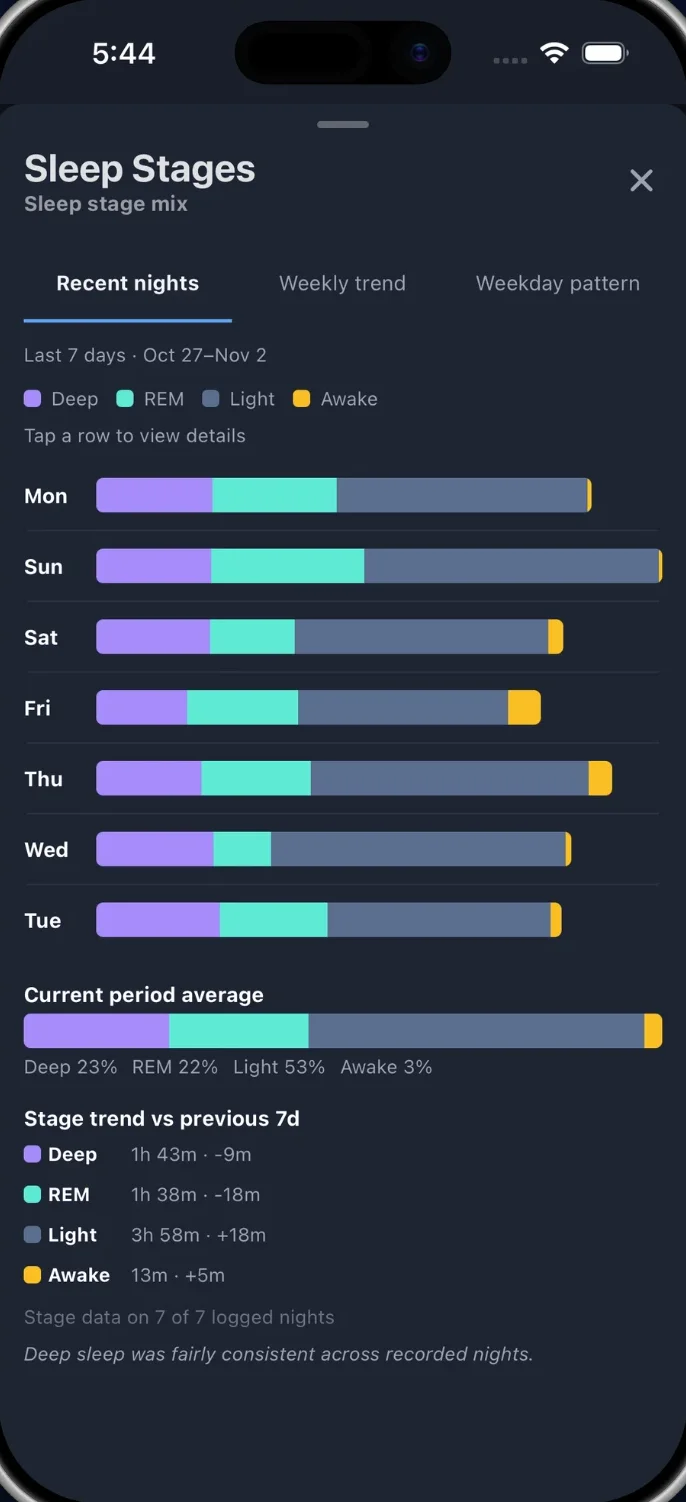
Record your sleep and how you slept.
Keep track of when you sleep and how the night went, then review your schedule and sleep over time.
- Record sleep. Log your nights and rate your sleep quality.
- Import supported data. Bring in sleep data from supported sources, including sleep stages when they’re available.
- Review your schedule. Compare recent nights, weekly trends, and weekday patterns.
ACTIVITY
Log your training and see how it adds up.
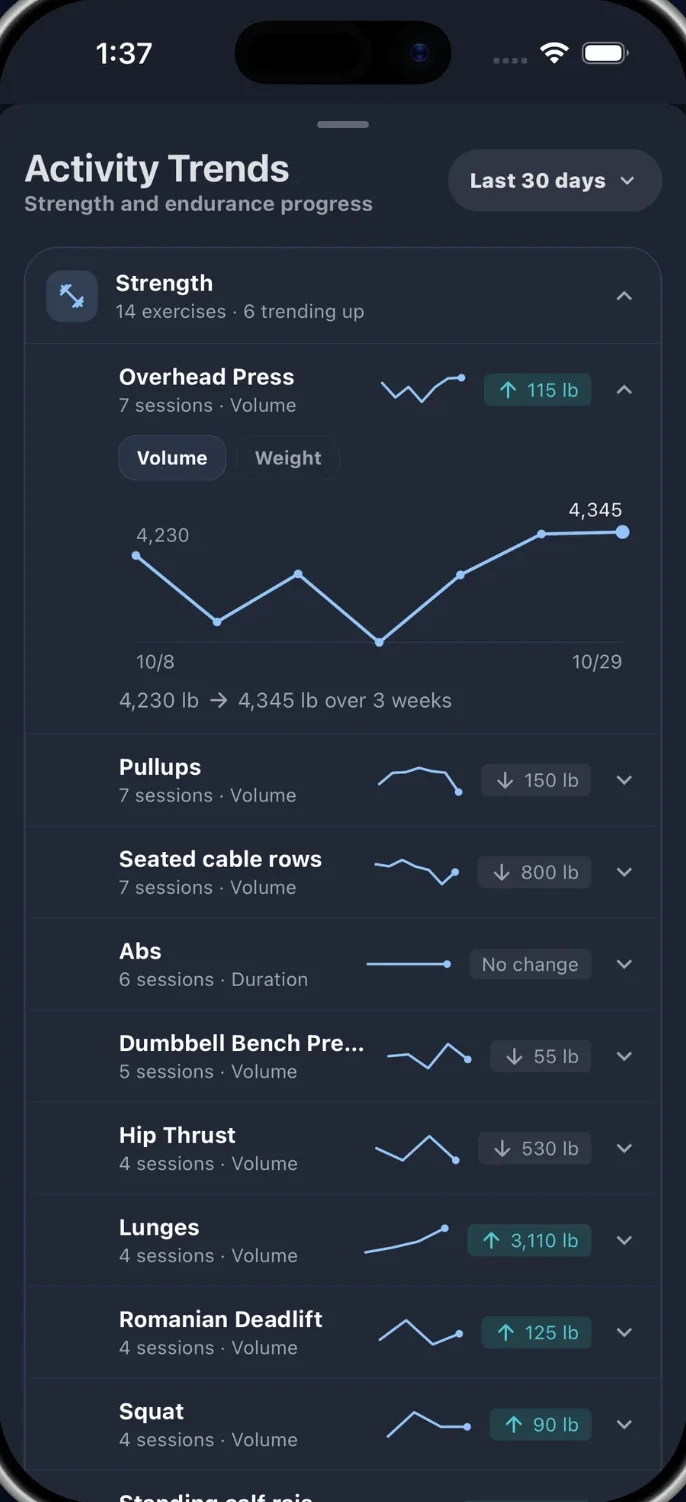
Whether you lift, run, or ride, log each session and watch your training build over time.
- Log strength workouts. Record your exercises and see how your volume changes.
- Log endurance activities. Keep running, cycling, and other cardio in the same place.
- Review over time. Choose a time range to see what’s trending up and what isn’t.
BIOMETRICS
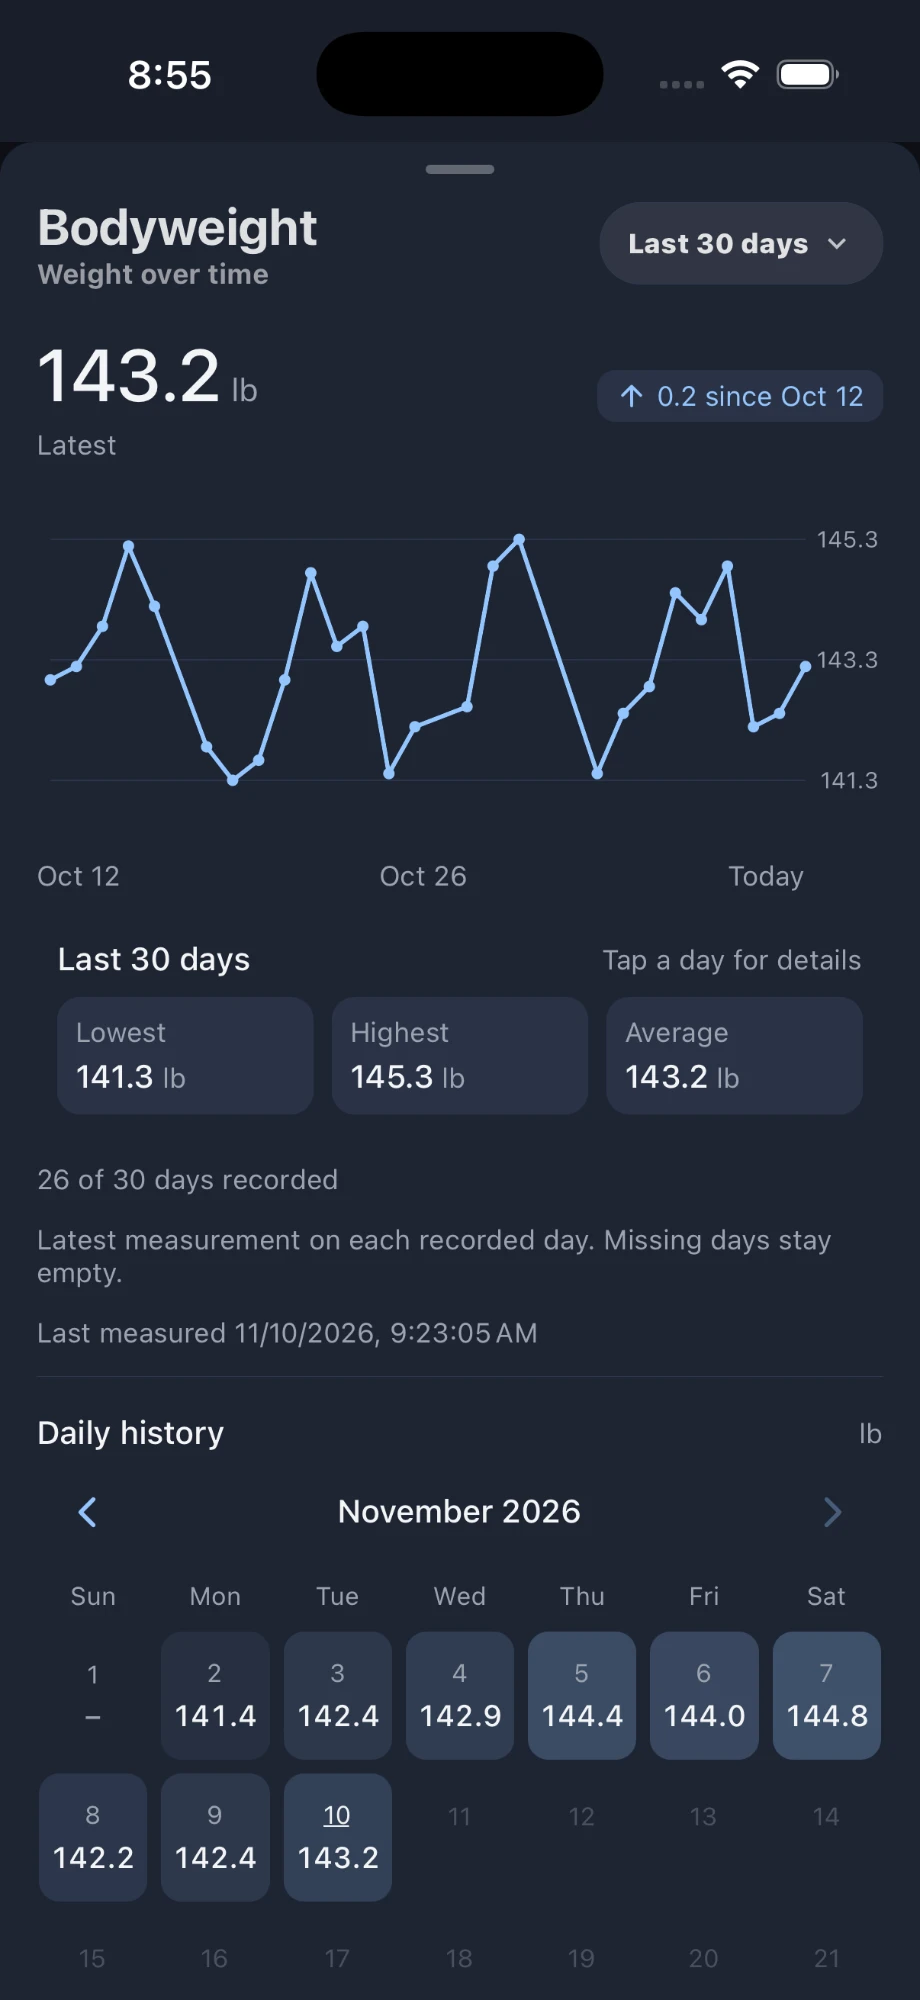
Bring in your body metrics.
Import weight, steps, heart rate, and other supported measures, so your body’s signals sit alongside what you eat, how you sleep, and how you feel.
- Import what you already track. Connect supported sources instead of typing numbers in twice.
- Look for patterns. See how your measures move across days and weeks, next to the rest of your picture.
Available measures vary by device and platform.